01 / Live data
Sample game-state feed
Receiving simulated updates
- Boss health
- 78%
- Attempt
- 42
Sample game data feeds the graphic as the encounter progresses.


Subspace by Maelstrom
Data in motion. Control in your hands.
Subspace is Maelstrom’s web-based graphics and live-data system. It brings operator dashboards, overlays and production data together for broadcasts, venue screens and remote contributors, with projects configured for each show.
Request a demo
Try the workflow
Watch sample data update the graphic automatically. Hide or show the graphic, or apply a manual value and return to the feed. This illustration demonstrates the workflow; each show has its own dashboard and graphics.
Sample feed updates every 3 seconds.
01 / Live data
Receiving simulated updates
Sample game data feeds the graphic as the encounter progresses.
02 / Operator controls
03 / Sample broadcast output
Following sample feed
The graphic follows the sample feed automatically.
Subspace in production
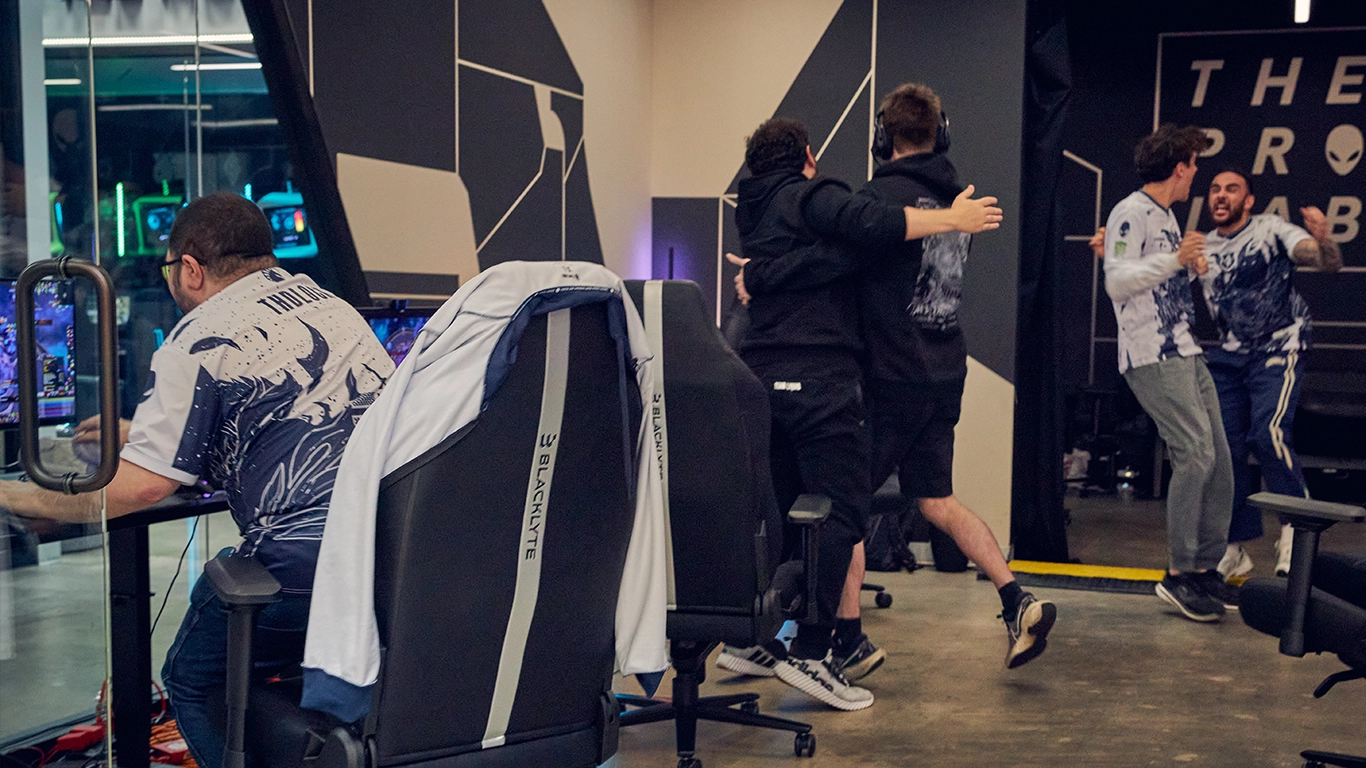
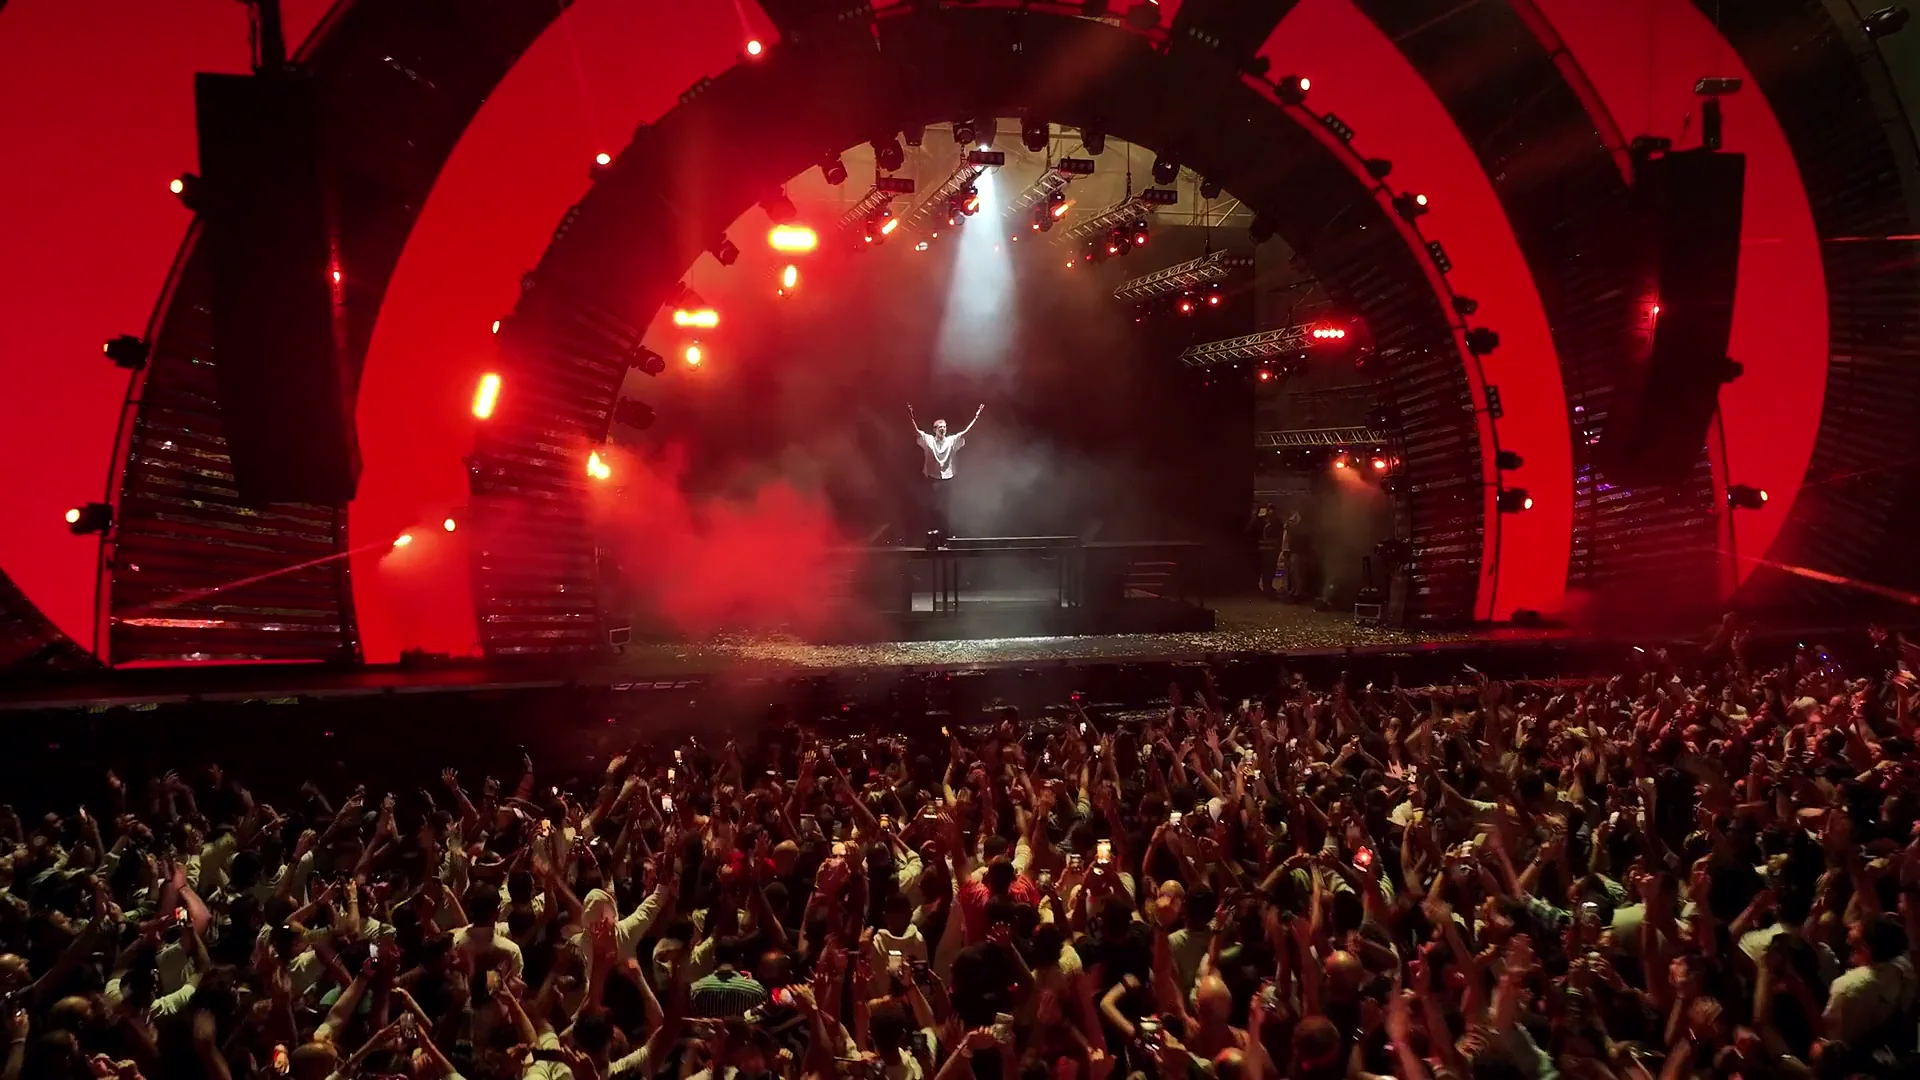
Selected controls from Team Liquid’s Race to World First deployment, alongside a frame from the broadcast. Live numbers become part of the viewing experience.
Select the current encounter and monitor the numbers that feed the show.
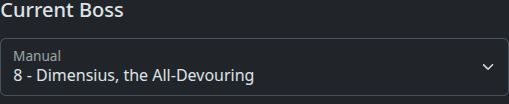
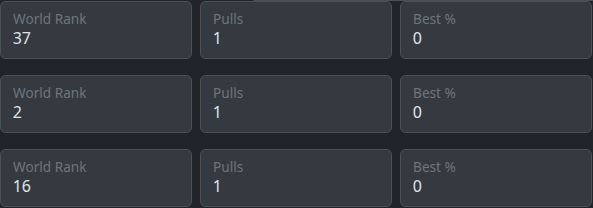
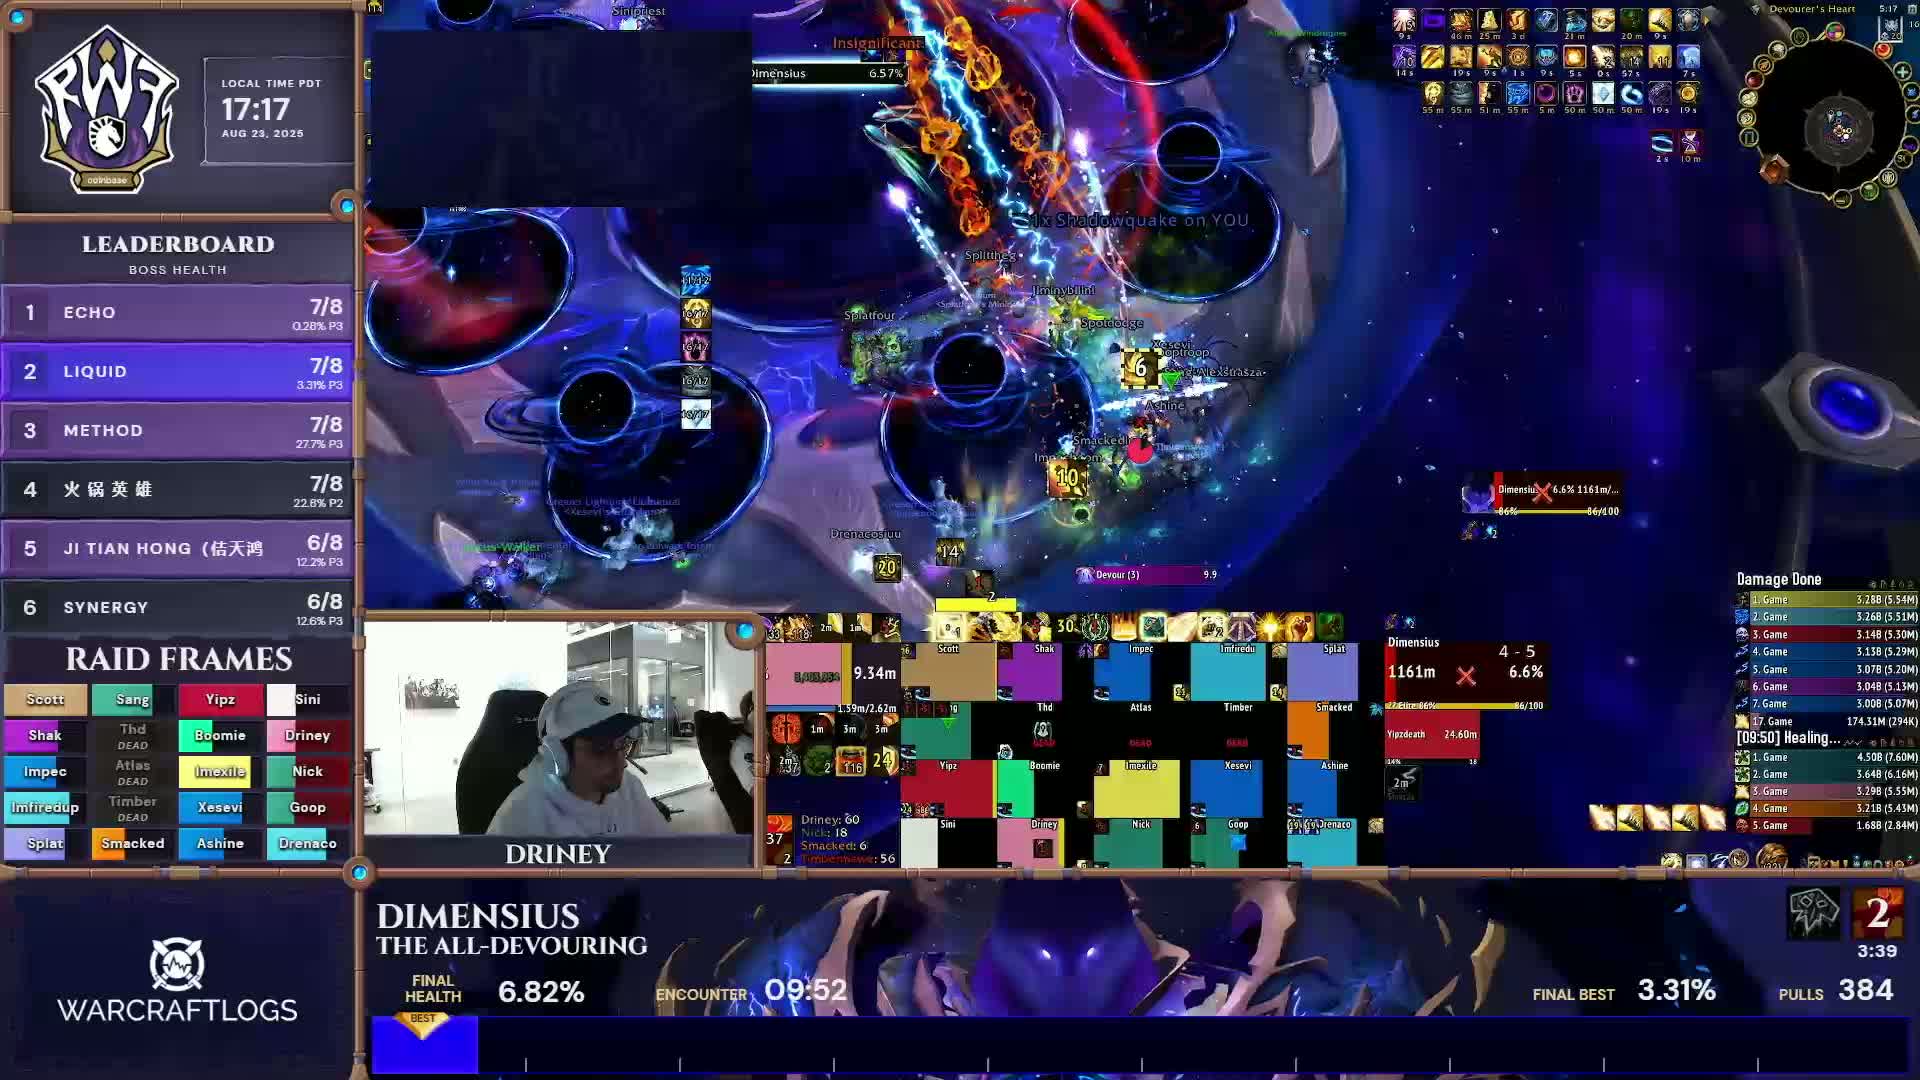
Two views of the same production, captured at different moments.
Explore the productionThe graphics system
Run Subspace locally or in the cloud. Maelstrom configures the graphics, data connections and operator controls around each show.
Manage names, lower thirds, timers and graphic states from an operator dashboard, with manual overrides and visible update states.
Bring in game state and external API data, or upload CSV datasets that fill related player, talent and production details.
Create separate dashboard and overlay packages for side streams, language feeds and test environments within a project.
Use Subspace’s API with Bitfocus Companion to include graphics and data actions in macros alongside OBS and other production tools.
Verified live deployments
Subspace demo